Friday, May 31, 2024

The Density Experiment

0 Comments


-----------------------------------------------


---------------------------------------------


----------------------------------------------


Monday, May 13, 2024

Compare & Contrast Characters

0 Comments


A Venn Diagram is a graphic organizer you can use when brainstorming similarities and differences between 2 or more stories, events, poems, creatures, people, poems, science data, shapes, etc.


To create a Venn Diagram, draw overlapping circles. Each circle represents something that you want to compare and contrast. Where circles intersect, you would write traits that the two things have in common.


Use these notebook pages to help you think of similarities and 
differences between the lamb and the jackalope in Boundin'! 

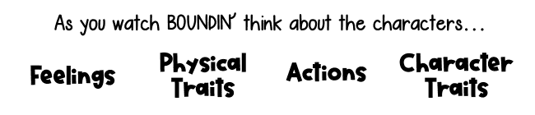
We can use a Venn Diagram to compare and contrast their physical traits, character traits, actions, feelings, etc. 

[click on the image above to view and download the notebook pages] 

Tuesday, May 7, 2024

How to Divide Decimals by Decimals

0 Comments


Hey Friends! This week we are going to divide decimals by decimals! What does it mean to divide?
Yep! Make equal parts or groups! 


To divide decimals correctly, you have to remember 3 things.
  1. Use graph paper or turn your notebook sideways to line up your numbers correctly.
  2. Move the decimal, so that your divisor is a whole number. What you do to the divisor, you do to the dividend.
  3. Use your mad long division skillz to solve. 


Here's a quick video lesson...


One more example...


Click here for the whole lesson!